Random Hacks of Kindness Oxford 2011 – The Humanitarian Project (IATI) Data
December 5, 2011
I was lucky enough to: a) hear about a global movement called Random Hacks of Kindness; and b) live in a city where one of the events was taking place. Throughout the world on the weekend of the 3rd and 4th of December, there were rooms full of geeks, probably fuelled with pizza (we were, at any rate) who were given a set of problems to choose from which were for the greater good. You can kind of think of it as an incubator where new projects are born, and the aim is that the end of the weekend isn’t the end of the project – it’s merely the beginning.
In Oxford, we had a choice between six projects including: predicting floods based on old weather data, visualising humanitarian data, building an app for fair trade cities and helping to improve a disaster management application called Sahana. I chose to go with the humanitarian data project because it involved playing with a huge dataset and I love creating interactive things and wotsits.
The problem was put forwards by Oxfam (who helped to set up an run the event) – but the aim was to allow any charity using the IATI database to get a copy of it and start using it. Exciting stuff! The IATI format allows for loads of (or minimal) data to be entered for each activity, and the API provides a way to query for pretty much whatever you want.
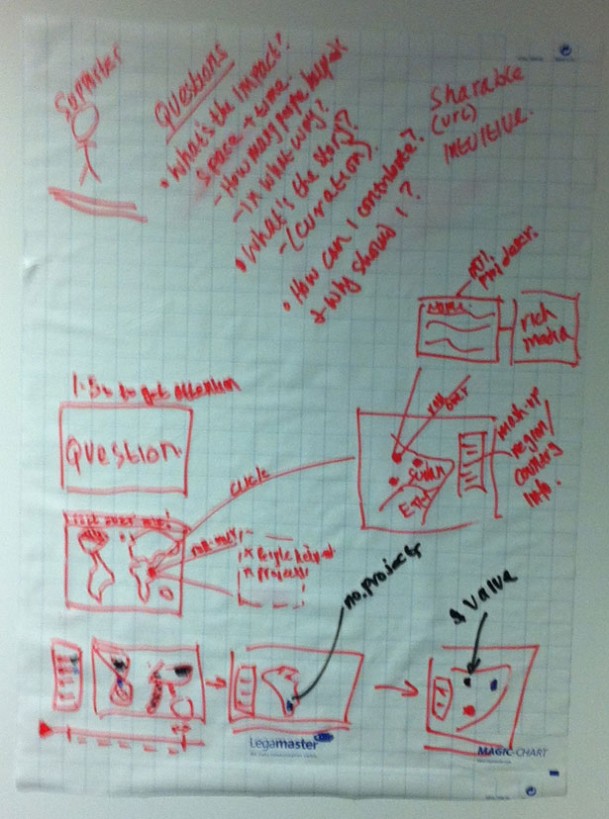
We initially had the idea of being able to drill down into countries and have pins representing projects in their actual locations, then from there you could click on one to learn more about the activity. Unfortunately, Oxfam’s data is relatively new in IATI (I think only a week-or-so) so much of this data was missing. We decided that we should therefore use pins on the map where geolocation details were present, but use a list to display the projects for the rest.
The data also spans a huge timespan – so I started wondering how cool it would look if you could press a ‘play’ button and see how different kinds of projects moved in both funding value or other criteria (perhaps with growing/shrinking circles or bar charts) and in physical location. I really like what Hans Rosling does with data, and thought it would be cool if we could find a couple of animations which really tell a story about how times change and funding solves problems. If you haven’t seen Hans Rosling’s TED talk you should do so. You can see the evolution of the idea (maybe, if you look hard and squint) in our scribblings.

After setting up Heroku, a github repository and wrestling for what felt like hours getting websockets to communicate properly, we set about building something more interesting than sending messages using the javascript console and watching for the reply from the server. It was time to dig in and get our hands dirty.
Then it was time for presentations. Oh dear. We’ve only got an H1 tag (with RHOK spelt incorrectly), an input field, and an anchor tag with no href attribute. I had to present the project armed only with the shady sketches we’d drawn before.
After that, we realised that our choice of using d3.js because of it’s amazing capabilities of both drawing data and transitioning through states would fall over because it became clear that the data wasn’t clean or consistant enough for us to do this within such a short timeframe. This was turning into a disaster.
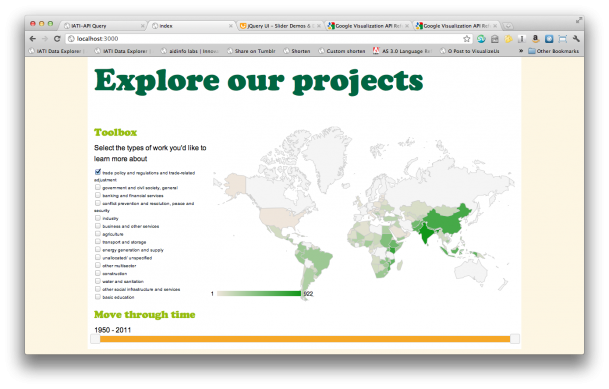
After pizza and beer, and with great thanks to Ben, we had a Google Geochart. From here, things would start to get better. We built a few queries, I finally got to grips with the IATI api, and came up with functions to methods to fill the Geochart with real IATI data. I hacked through the night and by the morning we had something which was beginning to not only work, but look pretty respectable too. It was hard at points, but seeing other RHOKers coding all night too was really encouraging and kept me going.
People began to arrive at around 10, we had breakfast and everyone got straight back into coding without a formal ‘now start hacking!’ prompt. Everyone was rearing to get back working on their projects and the vibe of the previous day fell back into place very quickly. You could hear the excited voices of people after they’d had a breakthrough.
The presentation in the morning was much better (starting at 3:32 in the video below) – I was feeling so excited about what we’d achieved that I even opened with an impromptu joke at the beginning about our H1 tag. How cool to be in a room where people would not only get it, but would laugh at it :). We got some good questions and suggestions at the end which we still need to (remember) and look into.
As the afternoon moved on, time faded away and final presentation approached people started winding down and exploring what other people had been doing.
So without further ado, I will present you with the fruits of my team’s labour: The Humanitarian Project (IATI) Data!
It is of course very much still a work in progress. There will be bugs, there will be browser issues, there will be times where it simply won’t work. It’s all open source and hosted on github so please get involved, report or fix bugs and spread the word.
This is going to sound awfully cheesy, but this is not the end, this is the beginning. I’m going to continue working on this project and I hope that others will be excited by this project and want to join in. It’s not only got the potential to both be pretty damn cool, but also to help charities explain the stories of their projects in a visually compelling way.
Thanks to White October for hosting the event, Oxfam for helping to organise it, and all of the sponsors (One, Incuna, Practical Participation and Guardian Open Platform) for providing pizza, beer, cakes & coffee, and to everyone there for providing the atmosphere for such a great time.
- Oxford’s page on the RHOK wiki.
- Visualising Programme Data on the RHOK wiki.
- Interactive display of humanitarian and development project data page.
- github repository.
- The actual thing.
I also got the opportunity to go into a shed with a hefty 3D printer in it. Next to it was a 3D print of a 3D printer in a shed while I was there. True story.
