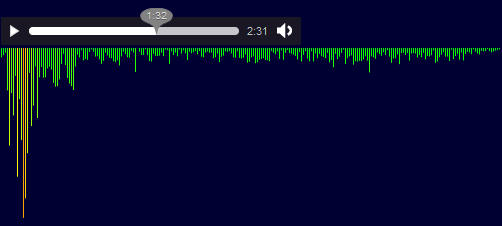
Playing with visualising <audio> with <canvas>
March 6, 2011
I woke up this morning and wanted to play with the HTML5 audio API and experiment with how data from it could be visualised. So I set to work and within a couple of hours had set up a very rudimentary graphic equaliser kinda-thingy. You’ll need Firefox 4 beta to see it, but if you have Chrome or Safari, the music is cool anyway ;)
I need to look into making it a little smoother, I think that the way I’ve applied the fast fourier transform to the data may be a bit dodgy because the bars jump around in a way which is not necessarily what you’d expect.
Over the next few days/weeks/when I have time, I’m going to play with how else the data might be visualised.
